It is very clear that rental properties must be in the right location and with the right numbers and it may not work well without getting both of those factors right. And it is very easy to make a mistake choosing a Condo for Investment that might generate looses instead of the wealth you expect.
What do right numbers mean?
Using the condo asking price and the actual or likely rental value, we can calculate cash flow.
Using themaintenance fee, property tax, and insurance costs, we can calculate the rental income or capitalization rate (cap rate).
Using the average price growth over the previous few years, we can calculate the average average annual market price growth for the condo,or just the previous year’s growth.
Finally, using the numbers, we can calculate one of the main indicators that measure the total return on a particular investment, relative to the cost of the investment—the return on investment (ROI). ROI is the cap rate (sometimes also called the annual net operational income of the rental property) plus theannual property value growth,divided by the property’s current market value.
If the numbers are not as expected, for example, there is negative cash flow or the cap rate, which is usually 5–6%, is 4.5% maximum (ignoring mortgage interest and any alternative costs) for downtown Toronto and if the ROI is less than what we a savings account or a mutual fund would produce, the factors leading to this could be evaluated. Is the asking price too high? Is the rent too low? Move on to the next factor, and continue crunching numbers until they make sense for an investment purchase. But is a long and sometimes annoying process, which might take weeks or even months!
Warren Buffett, an American investor, business tycoon, and philanthropist, famously said:
“If you need to use a computer or a calculator to make the calculation, you shouldn’t buy it.”
A potential investor should be able to make a purchase decision very quickly, spending little more than three to five minutes on calculations. We made some preliminary calculations that might help you to save your time.
The main key performance indicators for condo investment are worth a look. The indicators are based on publicly available annual data (realtor.ca, condos.ca, strata.ca and TREB’s statistical reports). The Report Ranking Toronto Downtown Condos based on ROI shows that not all condos with the highest ROI (12 %–15.6 %) are worth buying for investment purposes.
The 10 first-listed condo buildings have the highest market value growth (MVG) (within the first 16s positions) and the annual MVG for those condos is between 8.1% and 12.4%. MVG at that level is usual for the first three years after a condo’s registration. All but one of 10 top ranked condos are new (2016–2017 registration)—The 393 On King was registered in 2001.
However, those 10 Condos generate very low net rental income (2.75%–3.91%). As the break-even point is 3.0%, and the main contributor to ROI is MVG, this means that if the price does not increase, the investor will face a high risk of loss.
For each Power BI following report you may
Enlarge it for better experience
Turn to next or previous page
Share
For mobile users, we recommand to use those reports via your desktop
The data in a table 1 shows that one of those 10 buildings has an average annual net rental income (RI) of 2.75% per year, which is lower than the break-even point of 3.0%, meaning that if the property market value does not increase, the investment is very likely to result in a loss.
Let’s use RI to rank condos. The chart below shows that the 10 highest ranked condos based on RI (between 3.83 % and 4.52 %) have a net RI just marginally higher than the 3.0% break-even point (only 0.83%–1.52% higher). This means that these condos might generate a net income—after mortgage expenses and alternative costs (for example, investing the money at a bank deposit rate of 2%)— of between 0.83% and1.52%. But, those condos have a quitehigh average annual market price growth(4.02%–6.37%). So, condo investment becomes much more likely to be profitable where there is positive market price growth forecast. But if condo prices stop increasing, we should assess only net RI.
The interactive table below, Table 2, enables us to rank condos using any indicator.
To understand what combination of KPIs would be helpful for the investor, let’s look at the full list of 746 condos . And chart 3 shows RI, MVG and chart 4 – maintenance fees growth of 350 Toronto downtown condos selected for analyses
Taking into account that the first 10 Condo in a rank based on RI shown a high annual Market price Growth 3.87% – 6.37% per year we could make a conclusion that RI is the best Indicator for decision-making for short-term investor that allow to have a reasonable insurance of Investment profitability.
For better understanding relationship ROI, RI, MVG indicators and the current year price growth we could check the charts 5, 6 below:
Taking into account balanced indicators:
Net Rental Income
Average Annual Market Price Growth and
2018 – 2019 year Market Price Growth
It would be possible to create a list of condos that are likely to generate the highest net RI.
Good luck!
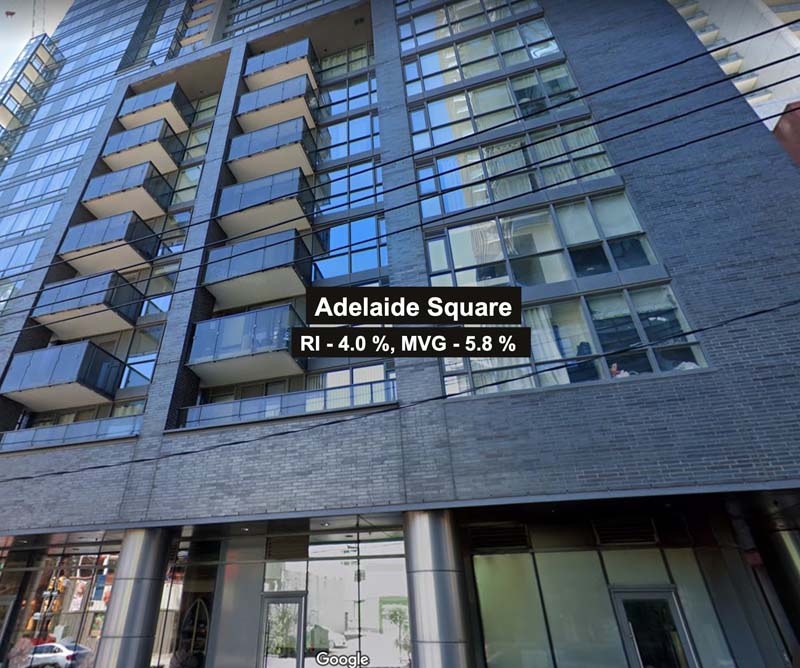
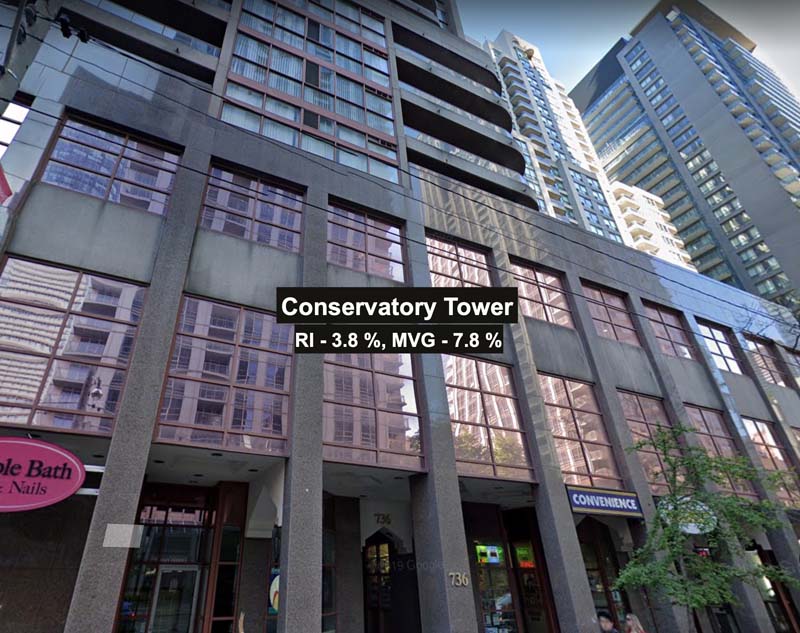
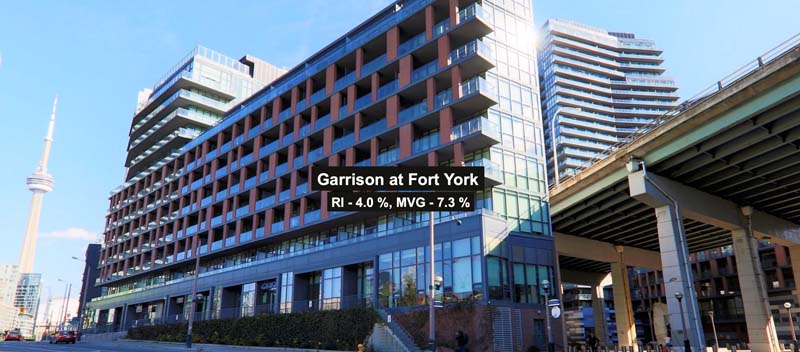
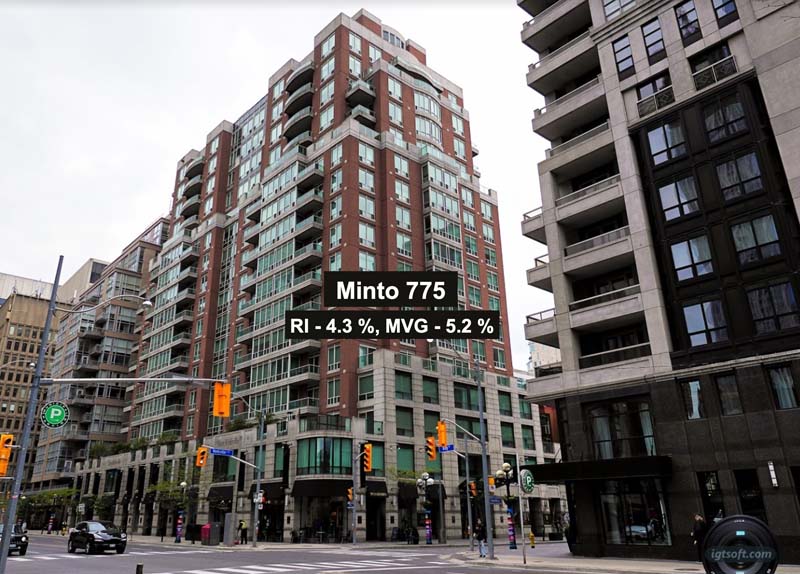
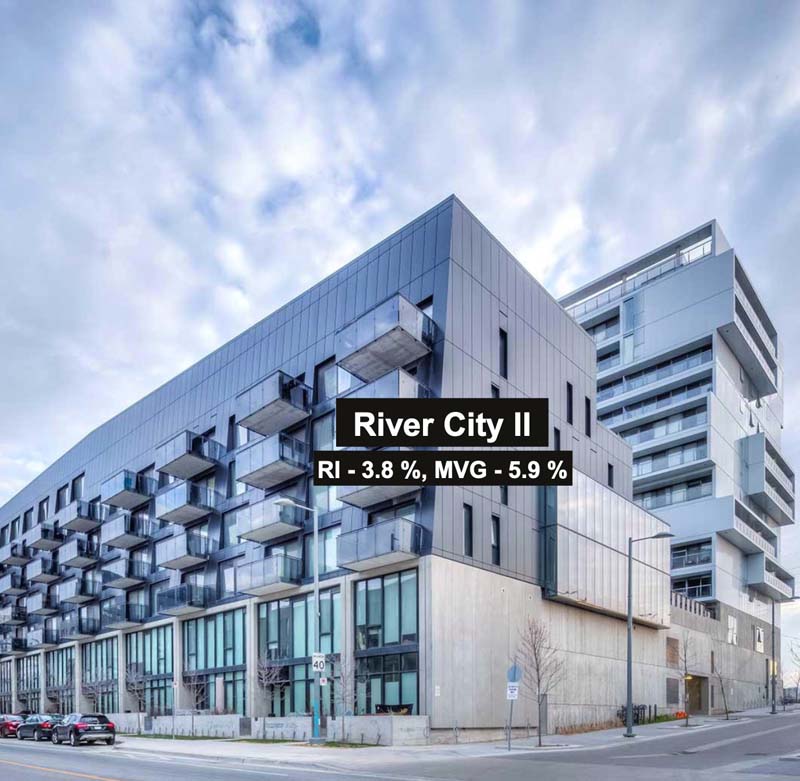
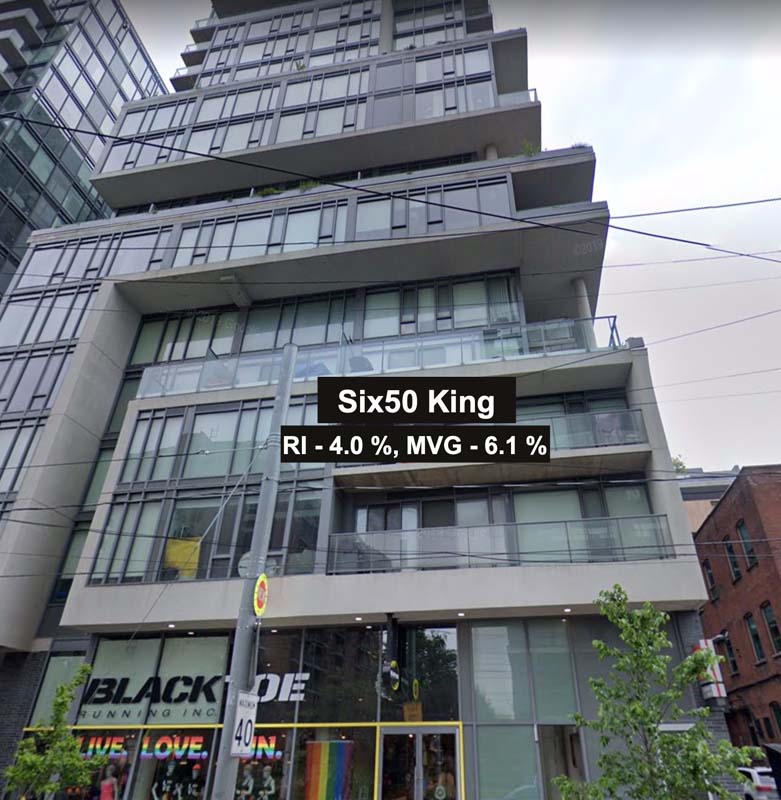
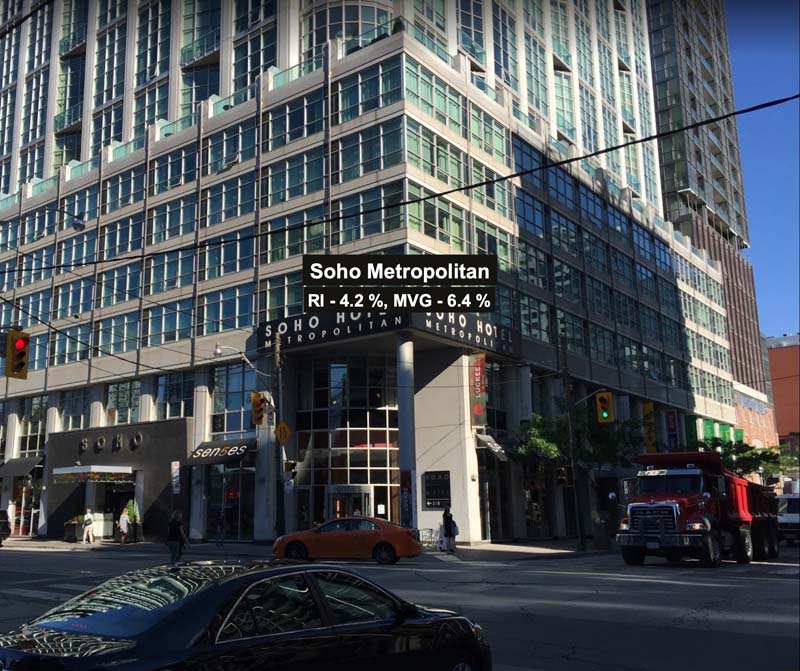
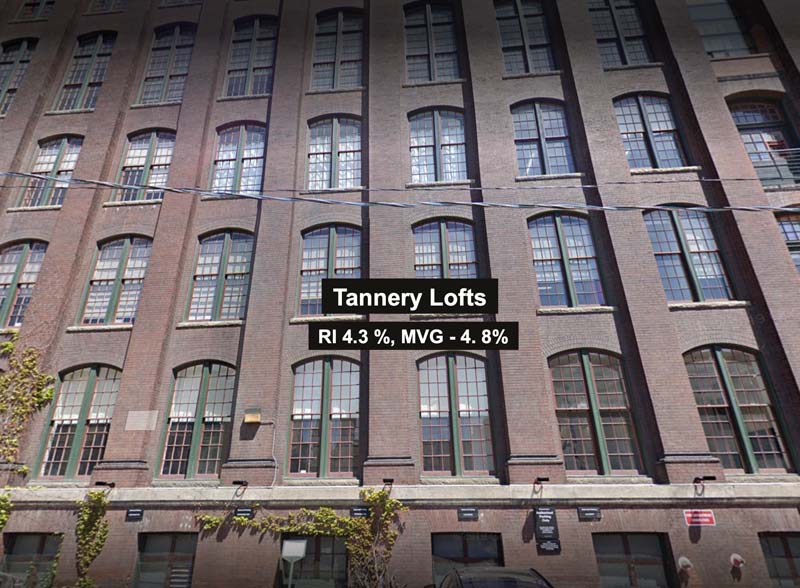
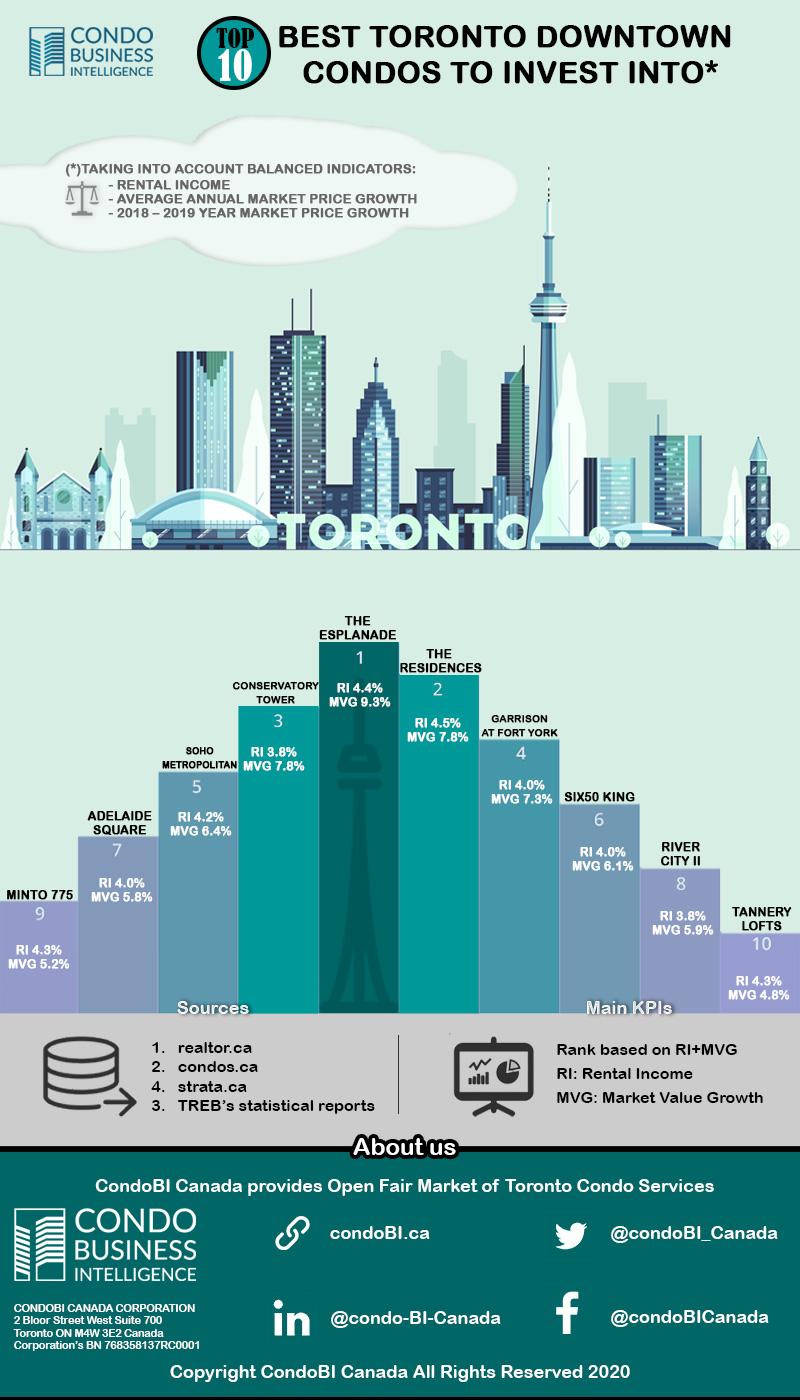
Top 10 Best Toronto Downtown Condos to Invest into
(click on each image to enlarge)
Infographic: Top 10 Best Toronto Downtown Condos to Invest into
Certainly, It is just an opinion and everybody making an individual choice.Hopefully, those Indicators might be useful for a decision-making process and make this process fast and pleasant for a potential Investor. And those decisions will serve Investors' goals perfectly!


Thank you for such unusual material. It was really helpful!
I am really enjoying the information you discuss on your web sites.