Real estate investing is an amazing form of investing that offers infinite possibilities to quickly generate wealth. But it is easy to make a big mistake without proper numbers.
It is really difficult to make a choice on a condo purchase for an investment (Example of Condo in Toronto in this page). Toronto condos are under a heavy demand in spite of high prices, increased mortgage rates and decreased mortgage opportunities in a few recent years, it looks like a perfect investment. It is quite clear for everybody that a cute condo in Core Downtown of Toronto is a high-liquidity asset for short and long-term investment that could be sold almost immediately at a higher price, anytime. And a rental Income provides you with a reliable vehicle to take you to financial independence. However,the reality is that not all amazing-looking condosin a perfect location makessense as a good investment.
How to make a right decision?
Condo right location and with right numbers would be the best Indicators for a decision – making. But which numbers to look for and where?
ROI (Return on Investment) = (Gain from Investment – Cost of Investment) / Cost of Investment. It is a very important indicator to gauge how your investment performs. ROI might be calculated as Annualized Indicator that combine RI and MVG. RI or Capitalization Rate (or Net Operational Income/ or Rental Income – a real Income you report on your Tax declaration) and MVG (an average % of the Property Market Value Growth per year – a conditional indicator that might be assessed accurately just at the final sale of the Condo ).
RI – calculates as last year Annual (Rental Price – Property Tax – Property Insurance – Maintenance Fee)/ Current Market Value), %.This is an annual indicator and assumes you own a property free and clear. Expenses include all your operating expenses such as Maintenance Fee, Taxes, Utilities, Insurance, etc. in $ and in %. If we wish to check how mortgage expenses will influence on RI, we need to multiply the mortgage rate by a share of the mortgage in the total investment. If we need to check how mortgage expenses will influence to RI, we need to multiple your mortgage rate by a share of the mortgage in the total investment.
For example, the investment combined 40 % down payment (with 2 % bank deposit opportunity forfeited) and 60 % mortgage, with 3.5 % interest. So:
the mortgage interest will be
60 % * 3.5 = 2.1 % of the total investment and this amount is going to decrease an annual RI by 2.1 %
the alternative cost, not receiving Interest from a bank deposit as 40 % of our own funds* 2% =0.8 %
risk premium for some small unpredictable circumstances at least 0.1 %.
And 3 % total!
So, MIN RI should be above 3.0 % (before mortgage Interest and other expenses)that will provide the Investor with a reasonable assurance of reaching a breakeven point, or Zero Cap Rate. For more Income, a Condo with a higher RI should be selected for an Investment.
3. MV – Average Market Value of Condo Sales based on the current statistics that available to the public.
4. MVG – Property Market Value Annual Growth in %
5. R PR – Average Rental Price of a Condo ($/SF) based on current statistics.
6. DoM – Days on Market (Average Number of Days to be on the market to sell a Condo), days
What would be the most useful Indicator to rely on?
Taking into account that the relationship between a purchase price and a rental price is unusual because a monthly rental price to a purchase price Indicator is between 0.4 – 0.5 % for Toronto Downtown Condos in spite of the usual practice, at least 1 % – 2 % of the purchase price that means, such property is worth to buy. Taking into account that one of the main reasons of such unusual situation might be constantly growing purchase prices that caused by external investor high demand and the fact that such prices are already not affordable for an average Canadian professional with an annual income of $100,000 (almost 2 times higher than the Canadian average Income ~ $55,000).
The other indicator is high rental price level that does not have a high probability for further growth. Furthermore, taking into account that MVG (Average Market Value Growth) is a virtual Indicator that might be changed any time, Net Rental Income or Cap Rate (RI) would be a more reliable indicator to rely on if Condo prices are stop growing.
Let’s take a look Toronto Downtown 350 Condos Interactive Ranking by ROI, Rental Income, Market Value and market Value Growth here.
And let’s select the list of Condos with the lowest RI indicator and collect them into the separate table here.
As we can see, there are 15 highly demanded Downtown Toronto Condos have a very low RI indicator (0.5 – 2.1 %) that might not even cover a Condo owner’s current expenses (mortgage interest, maintenance fee, insurance, taxes) .
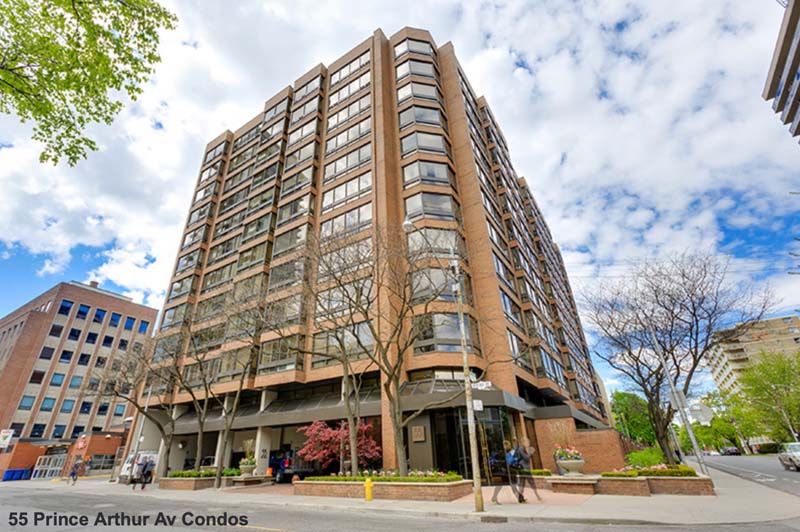
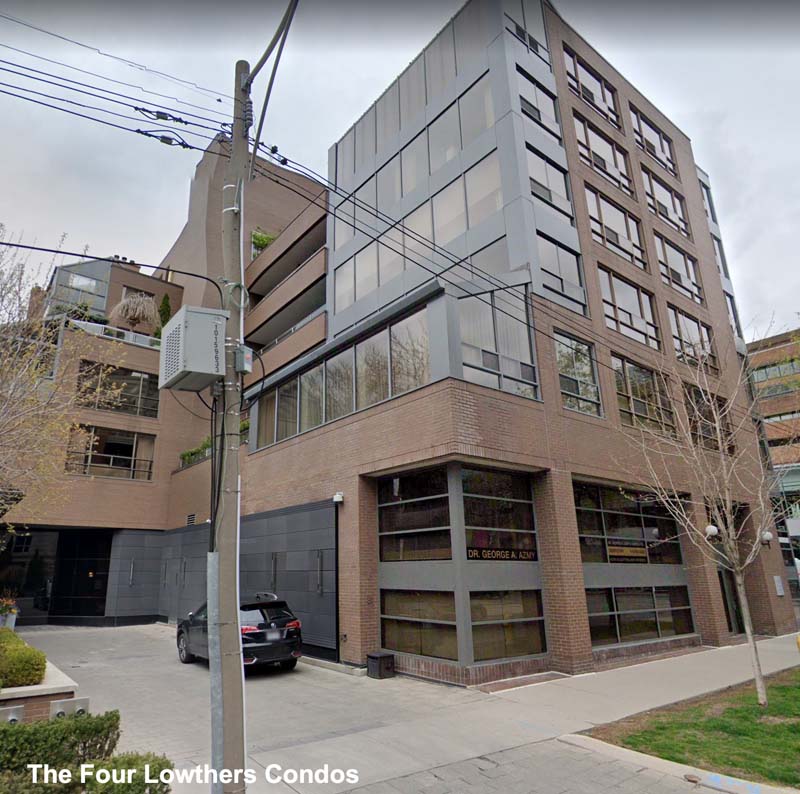
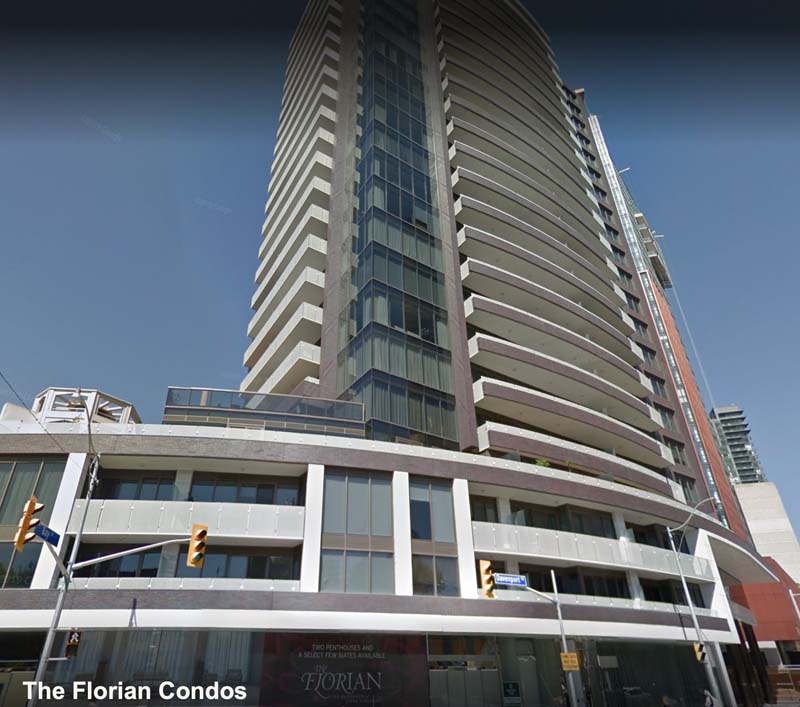
But 4 of those Condos: 55 Prince Arthur, Four Lowther, The Florian and The Kings Landing, represented as an exclusion of that data sample.
Those Condos are very special and expensive and rarely offered for rent
(click on each image to enlarge)
Those Condo buildings are to live in a luxury style and a comfort rather than to keep it as rental properties.
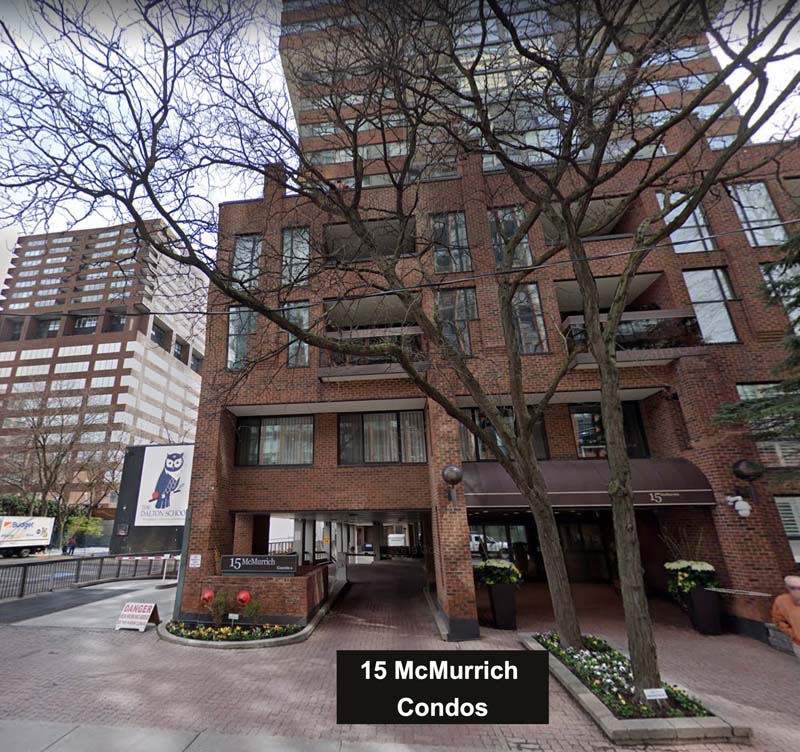
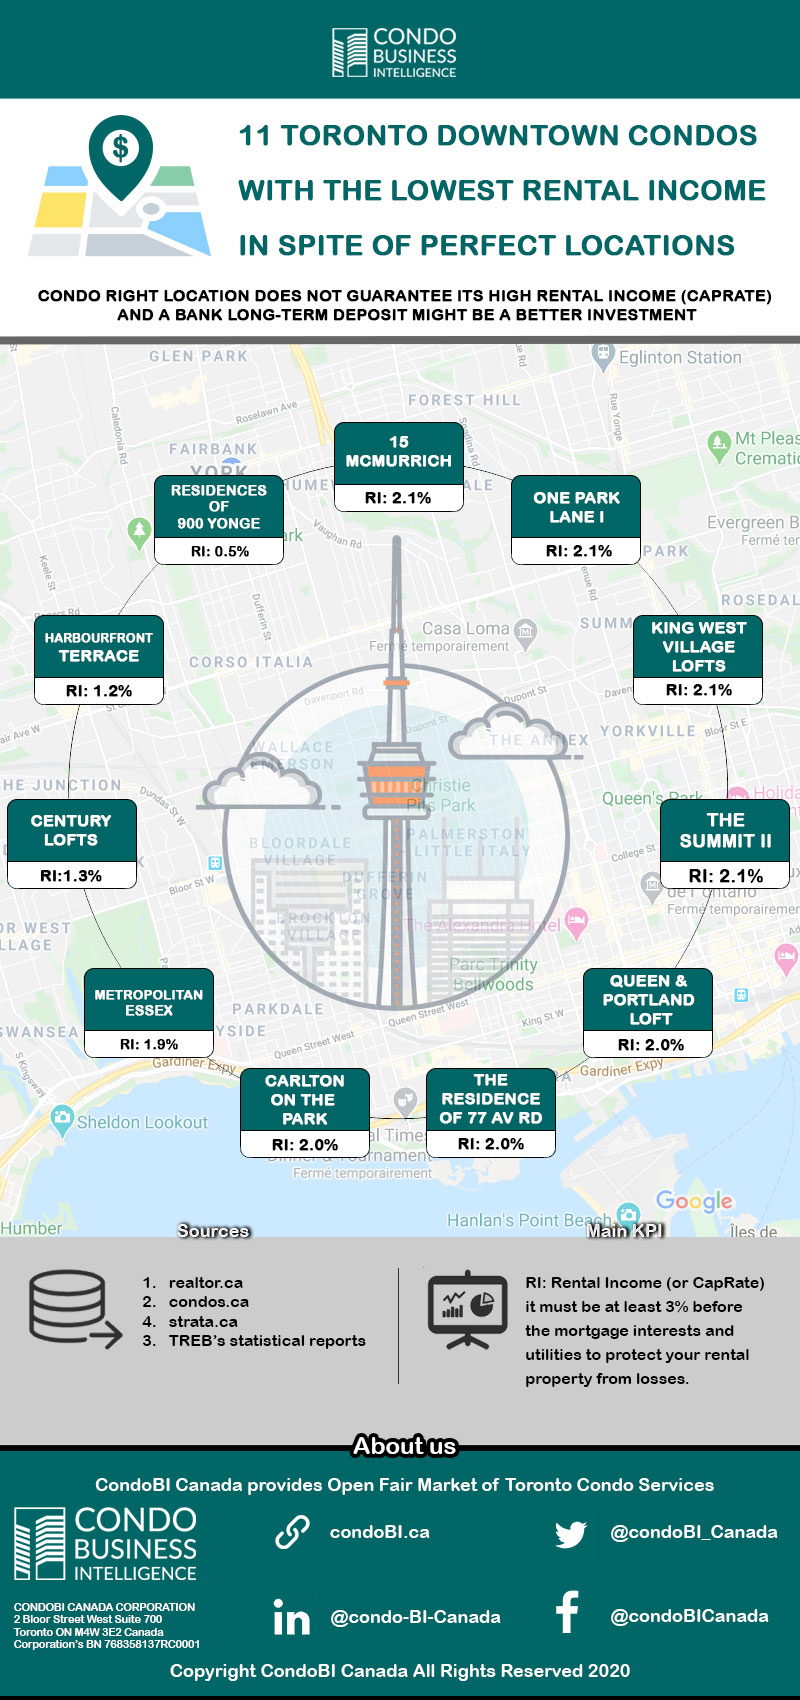
So, the other 11 Condo buildings in the list have 05. – 2.1 % RI (Net Operational Income, mortgage rate and alternative cost are not included) and investing in such properties might bring losses even we use our own funds. With a mortgage we need to choose properties with at least 2.5% RI in the case of 50% / 50 % combination of funds. But in this case a simple bank deposit might be more wise solution for your investment.
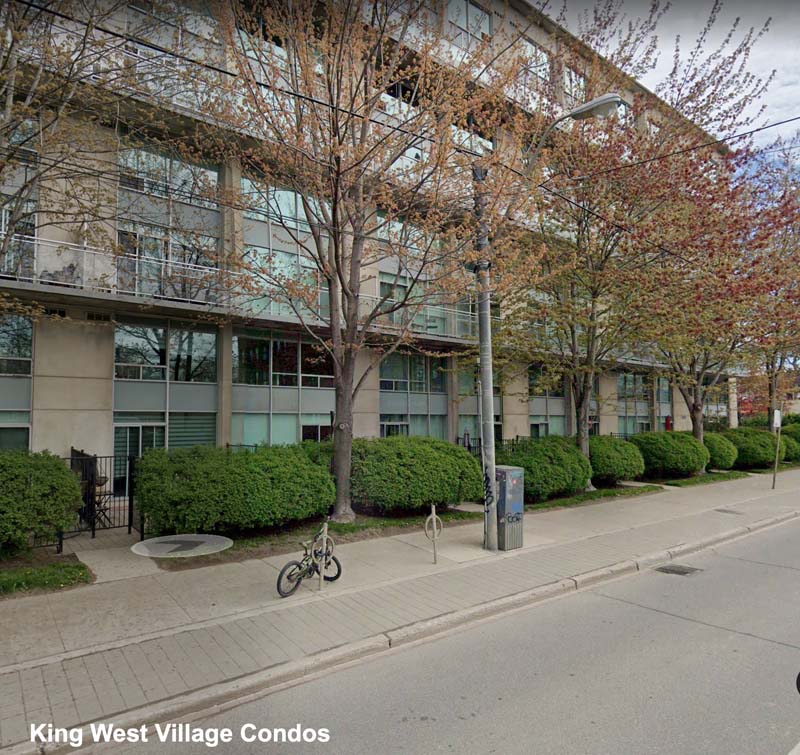
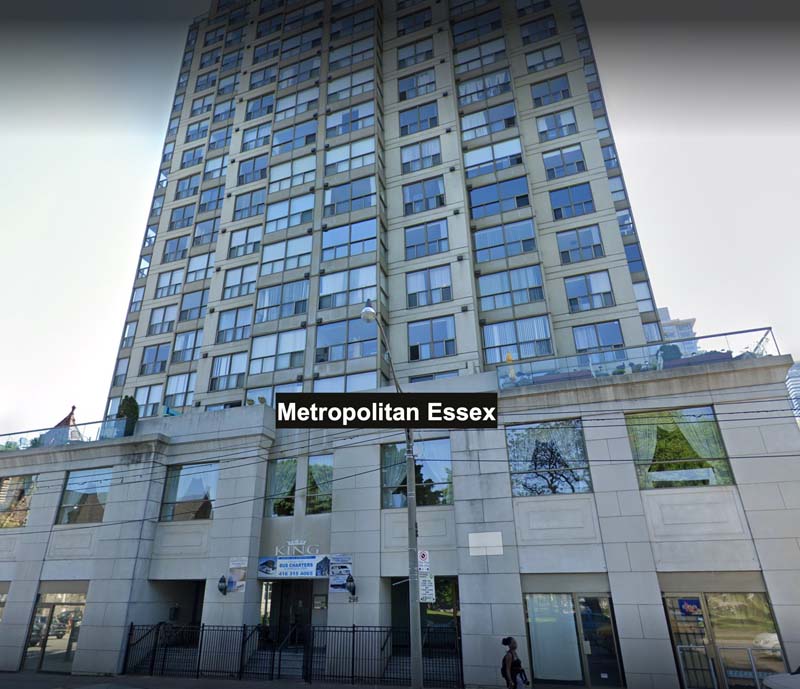
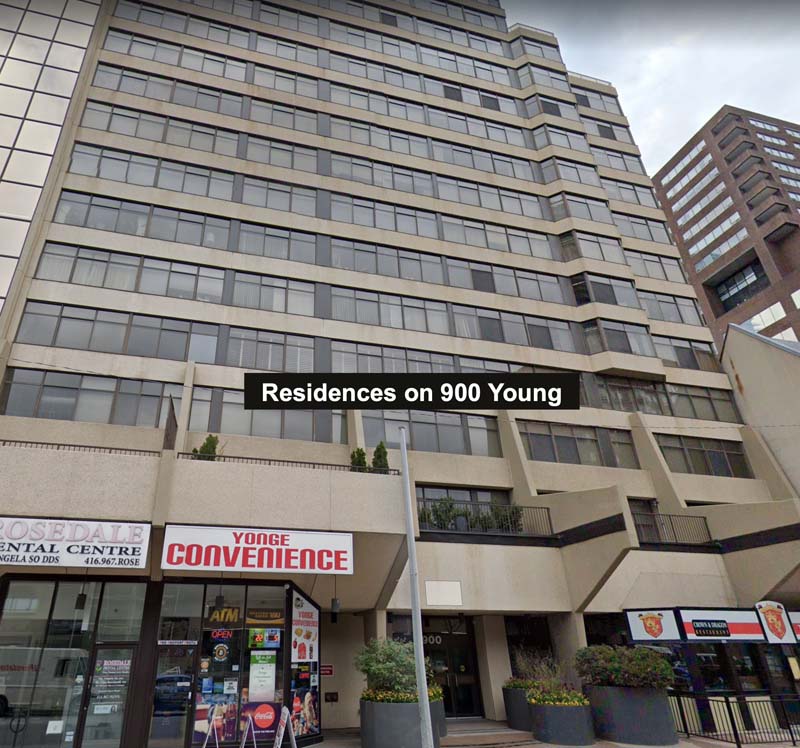
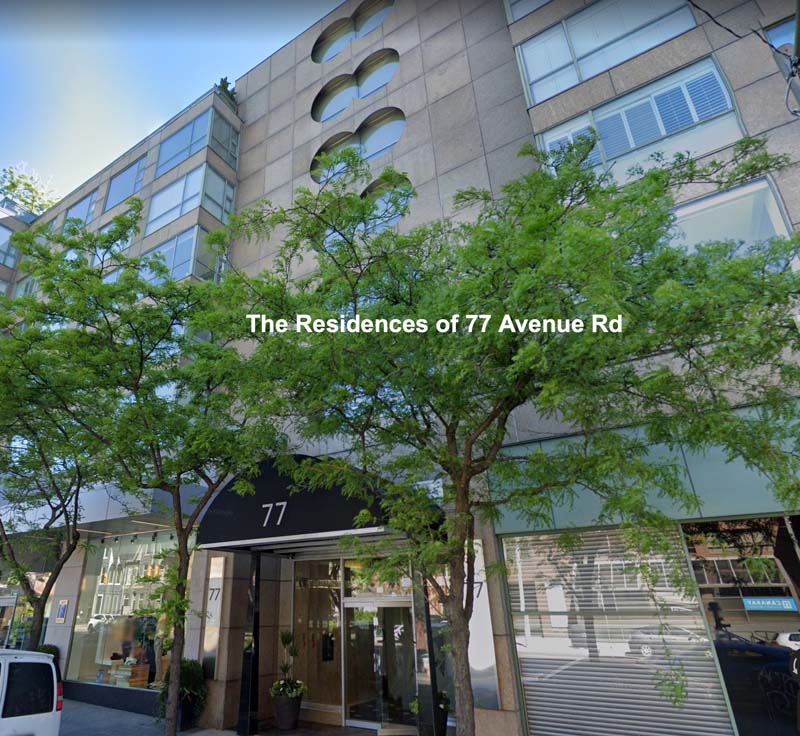
11 Toronto Downtown Condos with the lowest Rental Income in spite of perfect locations gallery
(click on each image to enlarge)
Infographic: 11 Toronto Downtown Condos with the lowest Rental Income in spite of perfect locations
Certainly, it is just an opinion based on average annualized data available to the public.But different Condo Units are maintained differently and might generate different income. And the Condo market price situation is changing. If the prices will grow up as it was during last a few years, by 8 % - 15 %, the rental income might be neglected.
This is just some basic information that might be useful to make a wise investment decision regarding BUY or NOT TO BUY and WHAT TO BUY when the market price situation is not clear for a future growth.